How the things we own vary at different levels of net worth
Do people at different levels of wealth spend their money on different things? Of course they do.
Some of these differences are by necessity, of course. If you have a million dollars in net worth, for example, then even average spending on your weekly meals will make up a much smaller portion of your net worth than the same spending would for somebody who has a net worth of $10,000.
(To put it another way: If you have two families that both spend $100 per week on food, but one family has a net worth of $1,000,000 and the other family has a net worth of $10,000, then the wealthier family spends less than one-tenth of one percent of its wealth each week on food while the poorer family spends one percent of its wealth.)
To illustrate how people at different levels of wealth allocate their money differently, the folks at Visual Capitalist have collated data from the Federal Reserve’s 2016 Survey of Consumer Finances to create this chart. (Click image to open full-size version in new window. Or visit Visual Capitalist for more info.)
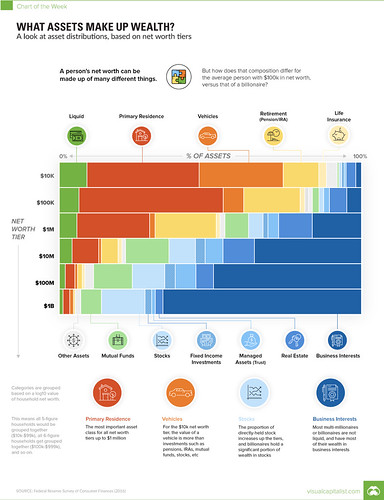
The chart divides Americans into six groups based on net worth. For each group, it shows how much of this wealth is in various assets, such as cash, housing, and cars.
Most of the info here is unsurprising. At lower levels of wealth, certain assets make up a disproportionate amount of a person’s net worth. Basic housing, for instance, is by far the most important asset for folks with less than $1,000,000 in net worth.
There are, however, a couple of things that stood out.
- First, look at the value of vehicles as a percentage of net worth. For folks under $100,000 in net worth, vehicles make up almost as much wealth as housing. Holy cats! This is insane — and in a bad way. Cars are a depreciating asset. In fact, they depreciate quickly. If you’re piling much of what you own into the value of a vehicle, you’re basically throwing money away. From my experience, the wealthiest people I know drive the least-valuable cars. Coincidence or cause? You make the call.
- As net worth increases, business interests make up a greater percentage of wealth. I guess this makes sense, but it’s nothing I would have ever thought about. Not all of the wealthy people I know own businesses, but a greater percentage do than the folks I know who are poor. Not sure which is the chicken and which the egg in this scenario, though. Do people who own businesses build wealth? Or do people with wealth invest in businesses? Or both?
Inspired by this, I tried to create my own bar graph in Microsoft Excel. I failed. I did, however, make a “doughnut chart” using the same color scheme as the Visual Capitalist chart.

I was surprised to see that my asset distribution — representing a net worth of roughly $1.6 million — is very similar to the asset distribution for the millionaires in the chart above.
Where there are differences (the average millionaire has more non-residence real estate than I do), it’s because of the way I’ve classified things. A huge chunk of my retirement mone is in REITs, for instance, which are like mutual funds for real estate. In other words, I do have about the same amount of money in real estate as the average millionaire but I didn’t call it out that way.
Another point of interest: My net worth contains less liquid cash than other folks at a similar level of wealth. And believe me, I feel it. It sucks. The older I get, the more I understand why it’s important to keep at least some cash readily available in bank accounts so you don’t always have to be selling mutual funds to generate working capital.
I’m not sure there’s anything actionable to be gained from this info, but it’s interesting to look at.

Become A Money Boss And Join 15,000 Others
Subscribe to the GRS Insider (FREE) and we’ll give you a copy of the Money Boss Manifesto (also FREE)

There are 35 comments to "How the things we own vary at different levels of net worth".
Interesting analysis. I’m slacking on business interests myself. I’m assuming my newish blog that’s not making any money yet is not worth anything. Maybe one day that will change.
Seems pretty obvious that people are not wealthy unless they build businesses. Granted, that could be a pretty broad category, but seems seems to me to be a pretty well establish fact that:
-People who are poor use their time to earn money to pay their costs.
-People who are middle class use their time to earn money to pay their costs and use their surplus money to sustain value.
-People who are wealthy use there time to figure out how to use other people’s money to pay their costs and use their surplus to increase value. (aka business)
To be sure, the business/wealth cycle can be circular and self-sustaining, but it seem fairly well documented that a person doesn’t manage to transcend from middle-class to wealthy unless they understand that you can’t become wealth on your own–it take other people’s money too.
According to the chart you can definitely reach $1 million with the “middle class” strategy. Who knows between $1 and $10m, but, even the $10m group only has an average of, what, 40 or 50% in business interests and real estate? Does that mean you can get to 50% of $10m, i.e. $5m, with the middle class strategy? Maybe.
Of course it’s going to be really hard to get to $1B without some kind of leverage / founding a business / etc. Even the highest paid sports stars would have to invest their sports earnings in something that would grow it. That said – if your goal is to become a billionaire, in my humble opinion you should choose a new goal.
Maybe I’m not typical but I’ve reached high seven figures without ever having been involved in a private business. My whole career has been working for companies, and all my investments were financed by personal savings, I’ve never paid interest in my life. I think owning shares of stock or mutual funds is just like owning a business except you’ve hired someone else to manage it for you. Many landlords do this too.
One quibble I have with these comparisons is when wealth gets conflated with income/expenses. People with zero or negative net worth eat too, it’s an expense that’s paid for out of income, which is distinct from wealth. Asset allocations vary by net worth (along with a whole host of other things I’m sure), and so do spending breakdowns, but assets and expenses aren’t the same thing even though both cost money. Wealthy people usually try to put more of their income into the former than the latter, juggling expenses alone won’t get you there. Despite what the self-help books say, you ain’t gonna spend yourself rich!
Interesting post. I am interested in your comments at the end regarding how much you should have in cash when retired. That could make for an interesting topic.
For example, our financial planner suggested that we have 2-3 years of living expenses in cash in retirement. Seems like a lot, but I can see both sides. On the positive side, we wouldn’t be forced to sell assets during a downturn. On the negative side, that could be a lot of money that is not doing much work for us (e.g., in a savings account, CD ladder, etc.).
The charts are screwy. I don’t really expect anyone with a net worth of $10K to have ANY of their net worth in a primary residence. Who in the world has less than $10K of equity? Those guys are renters.
I also view your own personal chart with a raised eyebrow. Remember, the chart is about NET worth. Assuming your net worth is $1.6M, you put $448K into your down payment?
So if you read the bottom it involves all between 10k and 99k. So there is probably some higher net worth. Also I wonder how they treated married folks? Like sometimes the amount is different one person makes a ton while the other makes a lot lower. I could see it as some of it is because you earn that much you buy a home which is also included in assets.
I think its certainly possible and very likely in fact at that spectrum. They could have bought property on a FHA loan which only requires a tiny down payment so very little equity. Any equity they have may be cancelled out by large amounts of revolving and housing/car debt.
Most importantly, keep in mind that this is a measure of net worth, not income. These could easily be people on 7 figure salaries that spend every dime they make and then some on a house and car they shouldn’t have.
I think next time I figure out my net worth (which I do every month) I want to get a more complete picture. Normally I don’t include the things you do – especially housing and vehicles.
Also, I’m not sure which would be a better presentation of net worth – a donut / pie chart like the on you used in this post, or a bar chart like the one you wanted to use. Perhaps a stacked bar chart?
My housing is really pretty low at 5.6% and that is paid for, no mortgage. Cars are also pretty low at 1%. Everything else is stocks, bonds, alternatives and cash. No business interests.
That is one great thing about living in flyover country, geoarbitrage is automatic when it comes to houses, they are cheap here. My house is big, on two acres eight minutes from where I worked when I worked, but cost very little.
Did the chart maker address if there is a correlation between age and net worth? Maybe starting out, n.w. 10k, it’s mostly in the car you use to get to work?
Hey, Steve. The chart-maker didn’t address this question. But because the data is pulled from an annual (or maybe it’s tri-annual?) Federal Reserve study, I’m sure there’s lots of raw info you could sift through.
7% of my net worth is in business interests, but that is only because I work for an employee owned company and we get issued stock every year as part on our salary. My guess is that a lot of high-earners get paid in company stock and that is why the chart is so skewed. You don’t necessarily have to be a business owner to get up to a high net worth…
“For folks under $100,000 in net worth, vehicles make up almost as much wealth as housing. Holy cats! This is insane — and in a bad way. Cars are a depreciating asset. In fact, they depreciate quickly. If you’re piling much of what you own into the value of a vehicle, you’re basically throwing money away.”
This can also be explained by the fact that if you’re worth $10k, it doesn’t take much of a car to represent a substantial portion of your net worth. I have a friend on disability who drives a ’98 Sentra, which is probably still the single most valuable item she owns. Back when she bought it for $5k, it probably represented about 50% of her net worth.
It has been a good investment in the sense that she’s gotten her money’s worth. Until just very recently it’s been an economical, trouble free car which has reliably gotten her from point A to point B, which is what she bought it to do. (It’s now old enough that, even though she’s taken good care of it, things are starting to just plain wear out.)
I really like the visual. If you read the note, the $10k bar is $10k-99k, so $10k is a terrible axis title and $55k is a more accurate label.
I read it more like a timeline – as you go from $55k to $550k net worth, most of that growth comes from your primary residence. Then as you go from $550k to $5.5 M net worth, most of that growth (and all subsequent growth) comes from business investments.
A very useful extension would be including the negative net worth. I’d argue the hardest part of getting rich slowly is going from a negative or very low net worth to $10k+, and I’d love to see what’s dragging people down when they have a negative or very low net worth.
I’ll disagree that “daily driver”vehicles should not be part of one’s net worth calcs because the value at the end of the day is only what someone will pay for it, not what KBB reports. There will always be a gap. Perhaps you experienced this with your recent mini purchase. Could you sell it for the same you paid for it? Would you?
As for the liquid portion in your chart (well done on the chart by the way), what’s the percentage range of cash on hand one should strive for? 1% seems inconveniently low as you point out. 25% is my target to prepare for the upcoming sell-off in order to pick up several dividend paying stocks when they go on sale.
I dont know this is largely personal on how risk adverse you want to be. The more liquid the more you get hurt by inflation. Though if it is short term its not bad. At the very min I would keep in a cd or go to an online bank that overs at least above 1%. That way your not earning .01% at traditional banks.
Regarding the under $100k, more networth in cars than property…I’d imagine people under $100k are less likely to own real estate, and paying rent doesn’t add to net worth, nor does the value of a rental property (for the tenant). So it stands to reason that the most valuable thing they own is a car. Until they earn/ save enough to put into savings or buy a house if that’s the wish. And since most people in that range likely have car notes, their wealth is going into paying off the car, which only increases the percentage of networth occupied by the vehicle, and decreases or maintains the cash percentage of networth.
I don’t entirely believe it has to do with a more expensive vehicle choice. If you have debt/ no assets, a hoopty could easily represent the majority of one’s networth.
It could also be both like if you are not making that much and at 10k your car is a majority asset. If your low net-worth but a high earner you could buy a nice new car.
Only 2% for your car. Mine is zero since I don’t have a car. This chart is giving me ideas for how to diversity my asset classes.
This was an interesting exercise in both how mine and my husband’s numbers differed from those in the chart and in how clearly our numbers align with our priorities.
Our breakdown: Retirement ~70%; Taxable Mutual Funds ~12%; 529/ESA ~10%; Home Equity ~5%; Everything Else ~3%.
Are the forums coming back? I miss my forum friends.
I think one of the best things I learned along the way, from my parents, from Dave Ramsey, from the Millionaire Next Door, etc. was not to put too much money into cars.
I’ve had 4 cars in my life and on average I’ve kept them each 7.5 years. Out of the 4 cars, only one was new and it was really my worst car and stupidest car purchase. The average length of ownership for a used car in the USA is 5.5 years (6.5 for new) so I’ve bested that by two years each round. I also have stuck to mid-level cars that serve my needs. The last two cars have been Nissans, 4 door and comfortable (since my husband has had trucks for his last two vehicles) and the last one a small SUV since we have a little one with car seat and stroller, etc.
I’ve never leased, I did take a short loan for the last car but paid it off quickly. At present we have no car loans. I should start saving for our next cars as we are both driving 2013 vehicles.
Hey, Sam. Yes, the forums will come back — but we might have to start them from scratch. 🙁
Thanks for the reminder, actually. This was something that I was working on before I went to Florida, but then it’s fallen off my radar because of Life.
Yes, please!
Ugh, start from scratch? That would make me sad, I love looking back at my debt killing posts from 2007 which were or are on the forum.
You probably should put REITs in real estate investment.
I’ll do this later today. Our primary residence is just a smaller percentage of our net worth. That’s probably the big difference from the chart.
Yeah, I agree, Joe. You and Shara (S.G.) make good points about how these assets are split up. But I think the Fed is making the decisions (and probably have reasons for them), and the rest of us are just following along with how we classify stuff.
This would be amazing as an animation. Get on that JD. ;P
Haha. Hilarious. Actually, there’s SO MUCH stuff that I wish I could animate but lack the skills to do so. I know there are tools out there that automate “drawing” animations for folks, and I’ve considered using them, but so far I haven’t found the time. So many things to do — and not enough time to do them.
Interesting. I admit to some curiosity why retirement and passive investments would be treated as different categories. Especially while the IRA and Pension are the same. The IRA seems to have more in common with mutual funds and stocks than with a pension. I think if you start parsing those differently I wouldn’t be too different from the average.
I am always interested in how this analysis calculates the dollar value of pensions for net worth purposes. I have a relatively significant pension that is, I believe, more secure than average. But if I left my job I have no clue what the buyout would be, and the actuarial calculators I have found are all over the place, to the point of being useless.
So depending on the value of my pension I’m in the $100k to $1M range, and my [very rough, not including pension] numbers are:
401(k)s – 60%
Real Estate – 13%
Primary Residence – 15%
Vehicles – 3%
Mutual funds – 3%
Cash – 3%
If you included my pension I think my retirement would go up to closer to 80% and the other numbers would obviously drop.
https://www.nytimes.com/2017/02/19/your-money/where-the-worlds-wealthiest-invest-their-billions.html
This article from The New York Times last February brought me up short. I was particularly struck by how much cash Billionaires hold. Probably it’s cash-flow for businesses, was how I read it, although it also might signal some risk-aversion. This year (since I am long since FI but still working for fun and seven years away from RMDs), I’ve shifted some of our post-tax froth to a ladder of CDs, allowing us to keep up with inflation but providing post-tax income should we need it in the years ahead.
Great post, J.D.
When I read your article, particularly about automotive costs, I thought “Yea! That is pretty ridiculous!” and thought about the folks I’ve seen living in trailers with brand new mustangs alongside. Then i figured it must have something to do with 40 years ago you coudl buy a new car with your savings from a few years of work living reasonably but the cost of living exceeding the wages plus increased car costs made that untennable but still locked in the collective mindset.
Then I really thought about it. I started thinking about how my wife and my money plays out and its somewhere between the 100k and 1m spread, but without residence investment (something we’re currently looking to change). Then i thought back to before my wife and I got married and said “Well, if I wasn’t married, my net worth would be…. -25k or so. (that ought to tell you who has all the money here). Now if we ignore my debts(school) and my wife(who had the good sense to be born to parents with enough money to just pay her education up front), I’m somewhere around 10k net worth with enough liquid each month to pay debts at a slightly above minimal level. How does my car break into that setup? Before we got married? about 30% of my net worth. Now that isn’t to say “HOLY SMOKES WHAT DOES HE DRIVE!?!?” the answer is a 2001 Honda Accord. When you drive a car worth 2k-2.5k, but only have 10k in total assets, it is a huge part of your net worth even without being an extravagant vehicle. My MIL, who work for a dealership, has often said when I do or get work done on my car “You should just replace it! It’s old!” and I’ll ask her every time what she can get me with a V6, Leather (because yes, my $2000 17 year old car has both of those, even if they are aged, but well cared for) for $1000 down and $100 per month. She scoffs and tells me I need to put $300 a month into it. I have pointed out that a new vehicle’s insurance plus $300/mo means I can put $4000/year into my car and STILL just break even. That means I’m more willing to replace the engine in my car than I am to buy a new car. New cars are overpriced. For what its worth, I’m 30s and have had that car since I was in college in ’05, as a gift from a relative when it was worth quite a bit more. If I had to buy car, I’d probably buy something with much fewer options so that I could trade options for age and still it would be worth around $2-2.5k; not a crazy cost.
My point is the car cost at the low end is less a case of wasted money in deprecating value and more a case of there’s a minimum cost you need to spend on a vehicle if you want to make sure you get to and from work and that cost is, by the workings of simple math, a higher percentage in the 10k bracket.
Interesting side note: I calculated that my friends (or the average person i know) indulges in a smart phone every 2 years (approx 2k) and a new car every 5-8 years years (average 25k). That means we are spending roughly 10k on phones, and 25-50k on cars every 10 years. I’m starting to see why it’s taking millennials longer to get that house deposit saved (speaking for the Aus housing market here).
The Australian cell phone market is bizarre. Do you have a Cellphone import tariff that is fleecing you or is there that little market competition?
Even the iPhone X bought direct from Apple only costs $1200 USD for the 256gb unlocked version and that’s considered overprice here by normal people. A normal smart phone in the US is $500.